Mermaid 3D Visualization: Turn Mermaid Diagrams into True 3D
Mermaid has become the de facto standard for quickly drawing architecture, flow, and state diagrams for engineering teams. Traditional Mermaid diagrams are 2D only. iCraft Editor provides "Mermaid 3D Visualization", which converts standard Mermaid diagrams into interactive, true 3D scenes in the editor with one click, making communication, demos, and decision‑making more efficient and intuitive.
Highlights
- Supports mainstream types: native parsing of
architecture,flowchart-v2,stateDiagram - Style passthrough: automatically maps fill, stroke, text color, and line width
- True 3D elements: planes, cubes, cylinders, spheres, polygons, and a 3D model library; supports shadows and materials
- Auto camera composition: computes view angle and tilt from the diagram's bounding box for out‑of‑the‑box results
- Layered grouping and labels: groups are stacked by height; labels align more clearly
- Connectors and arrows: curved routing, arrows/double arrows, dashed lines
- Traceable relationships: nodes back‑reference connected edges for easier interactive selection and linkage
- Smart model mapping: for
architecturediagrams,icontags are matched to the 3D model library to make shapes more expressive
architecture
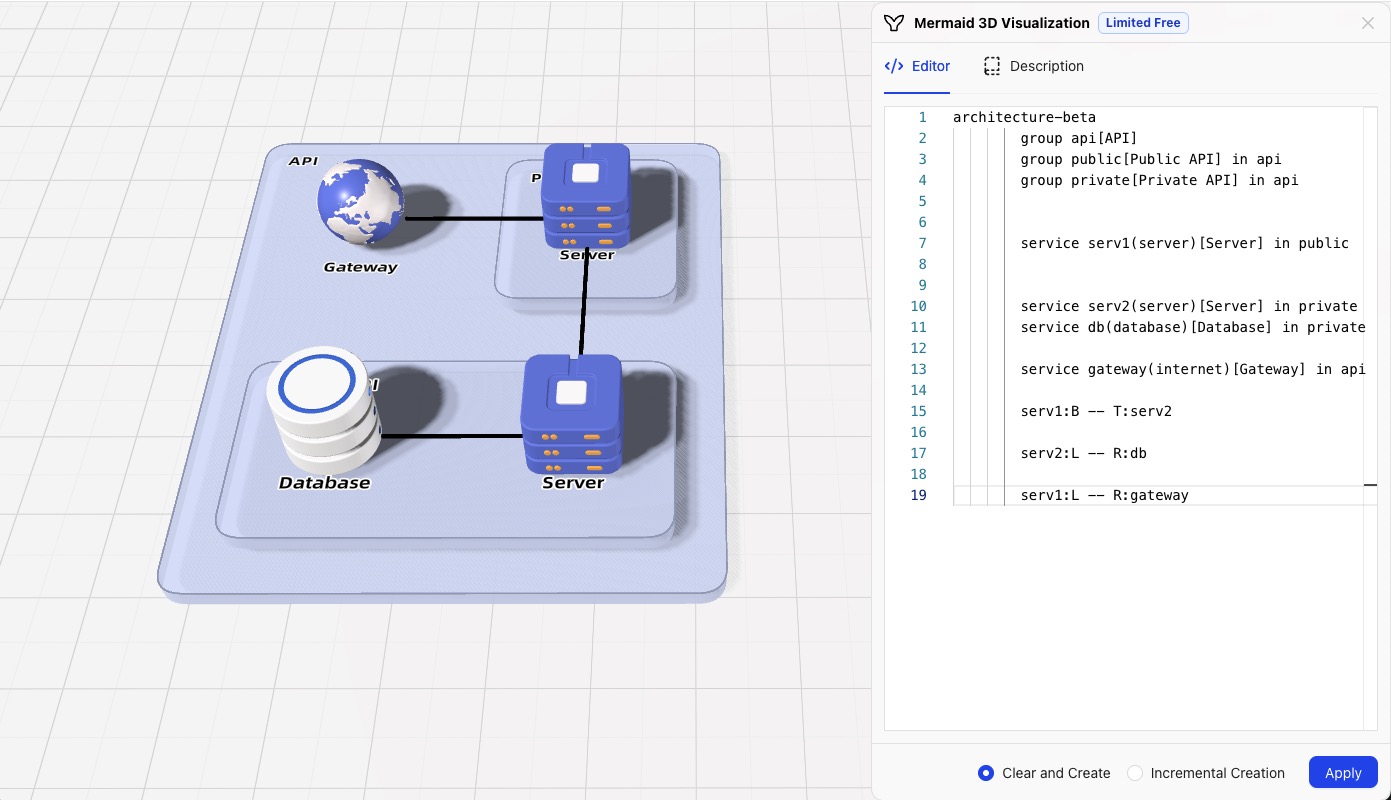
We recommend using architecture-beta to write architecture diagrams. Combined with iCraft’s 3D mapping, you can quickly generate professional 3D architecture scenes from plain text.
For flowchart and stateDiagram, Mermaid syntax itself carries styling logic, so iCraft renders 3D shapes according to Mermaid styles and does not automatically match the 3D model library.
Syntax Overview
- Group:
group groupID(icon)[title]optionalin parentGroupID - Service/Component:
service componentID(icon)[title]optionalin groupID - Edge:
sourceID:side -- side:targetID, side is one ofT/B/L/R; arrowheads can use-->,<--,<--> - Cross‑group edge:
sourceID{group}:side --> side:targetID{group}for cross‑group connections - Junction:
junction junctionID, used with multiple edges to create four‑way branches
Example:
architecture-beta
  group api[API]
  group public[Public API] in api
  group private[Private API] in api


  service serv1(server)[Server] in public


  service serv2(server)[Server] in private
  service db(database)[Database] in private

  service gateway(internet)[Gateway] in api

  serv1:B -- T:serv2

  serv2:L -- R:db

  serv1:L -- R:gateway
Icon Identifiers Map to 3D Models
-
In iCraft, the
iconidentifier maps directly (case‑insensitive) to names in the built‑in 3D model library, automatically replacing 2D placeholders with the corresponding 3D models. -
Recommended names aligned with the model library:
Server,Database,Storage,Gateway,Cloud,Internet,Redis, etc. -
Examples:
service app(server)[App Server]→ renders as a 3D server modelservice db(database)[Database]→ renders as a 3D database modelservice storage(disk)[Storage]→ renders as a 3D storage modelservice gateway(internet)[Gateway]→ renders as a 3D network/gateway model
-
If
icondoes not match any model name, it falls back to a cube. -
()denote the icon/component type, and[]denote the display title; they can be set independently.
Reference: Mermaid Architecture Beta syntax https://mermaid.js.org/syntax/architecture.html (opens in a new tab)
Result
flowchart
Syntax Overview
- Diagram direction:
graph TD,LR,TB,RL - Node shapes:
A[Rectangle],B([Rounded Rectangle]),C((Circle)),D{Diamond} - Connections:
A --> B,A ==> B,A -- text --> B - Edge styles:
linkStyle indexList properties - Class styles:
classDef name properties;class nodeList name - Subgraph:
subgraph title...end
Reference: Mermaid flowchart syntax https://mermaid.js.org/syntax/flowchart.html (opens in a new tab)
Example:
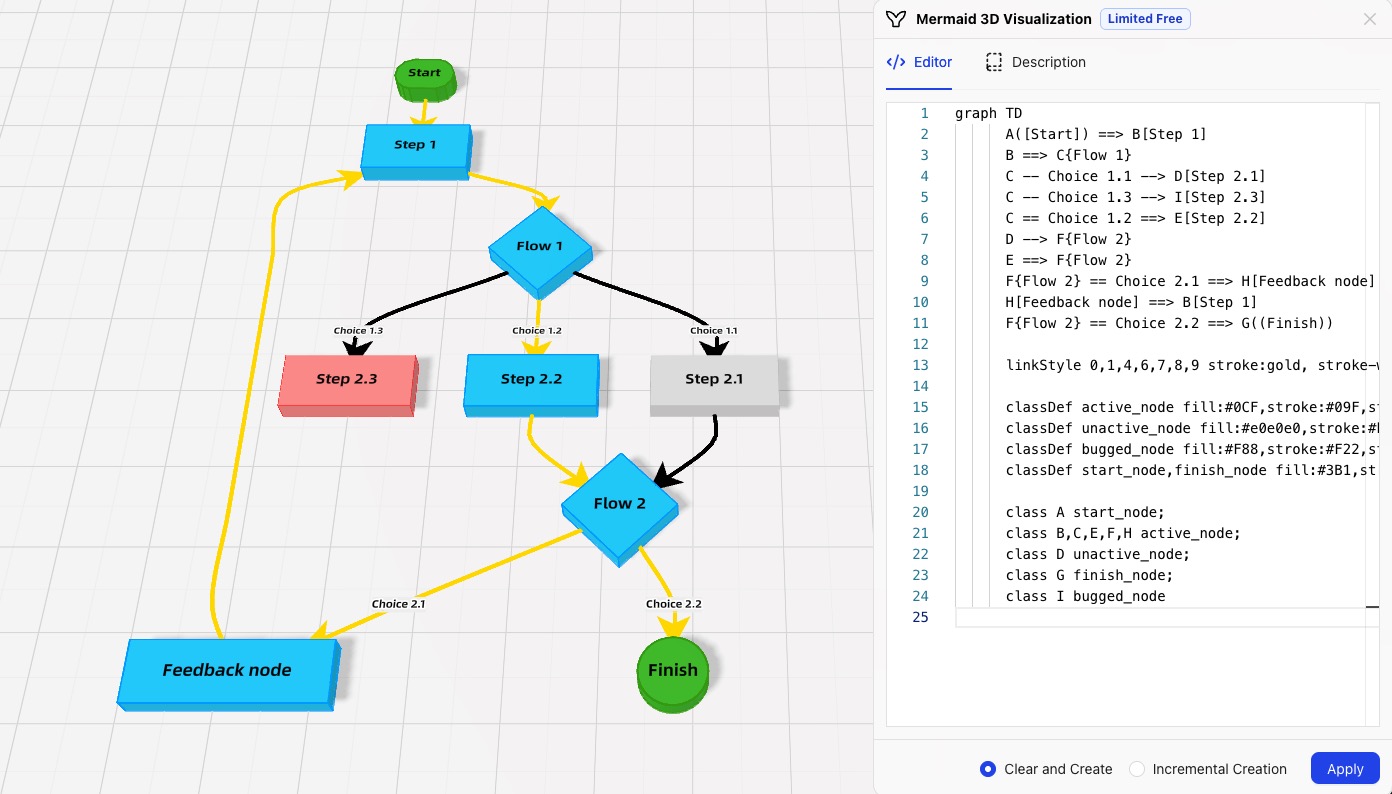
graph TD
  A([Start]) ==> B[Step 1]
  B ==> C{Flow 1}
  C -- Choice 1.1 --> D[Step 2.1]
  C -- Choice 1.3 --> I[Step 2.3]
  C == Choice 1.2 ==> E[Step 2.2]
  D --> F{Flow 2}
  E ==> F{Flow 2}
  F{Flow 2} == Choice 2.1 ==> H[Feedback node]
  H[Feedback node] ==> B[Step 1]
  F{Flow 2} == Choice 2.2 ==> G((Finish))

  linkStyle 0,1,4,6,7,8,9 stroke:gold, stroke-width:4px

  classDef active_node fill:#0CF,stroke:#09F,stroke-width:6px
  classDef unactive_node fill:#e0e0e0,stroke:#bdbdbd,stroke-width:3px
  classDef bugged_node fill:#F88,stroke:#F22,stroke-width:3px
  classDef start_node,finish_node fill:#3B1,stroke:#391,stroke-width:8px

  class A start_node;
  class B,C,E,F,H active_node;
  class D unactive_node;
  class G finish_node;
  class I bugged_node
Result
stateDiagram
Syntax Overview
- Direction:
direction TB,LR - Initial/Final:
[*] --> State,State --> [*] - Transitions:
A --> B,A --> B: label - Accessibility:
accTitle,accDescr - Class styles:
classDef name properties;class stateList name
Reference: Mermaid stateDiagram syntax https://mermaid.js.org/syntax/stateDiagram.html (opens in a new tab)
Example:
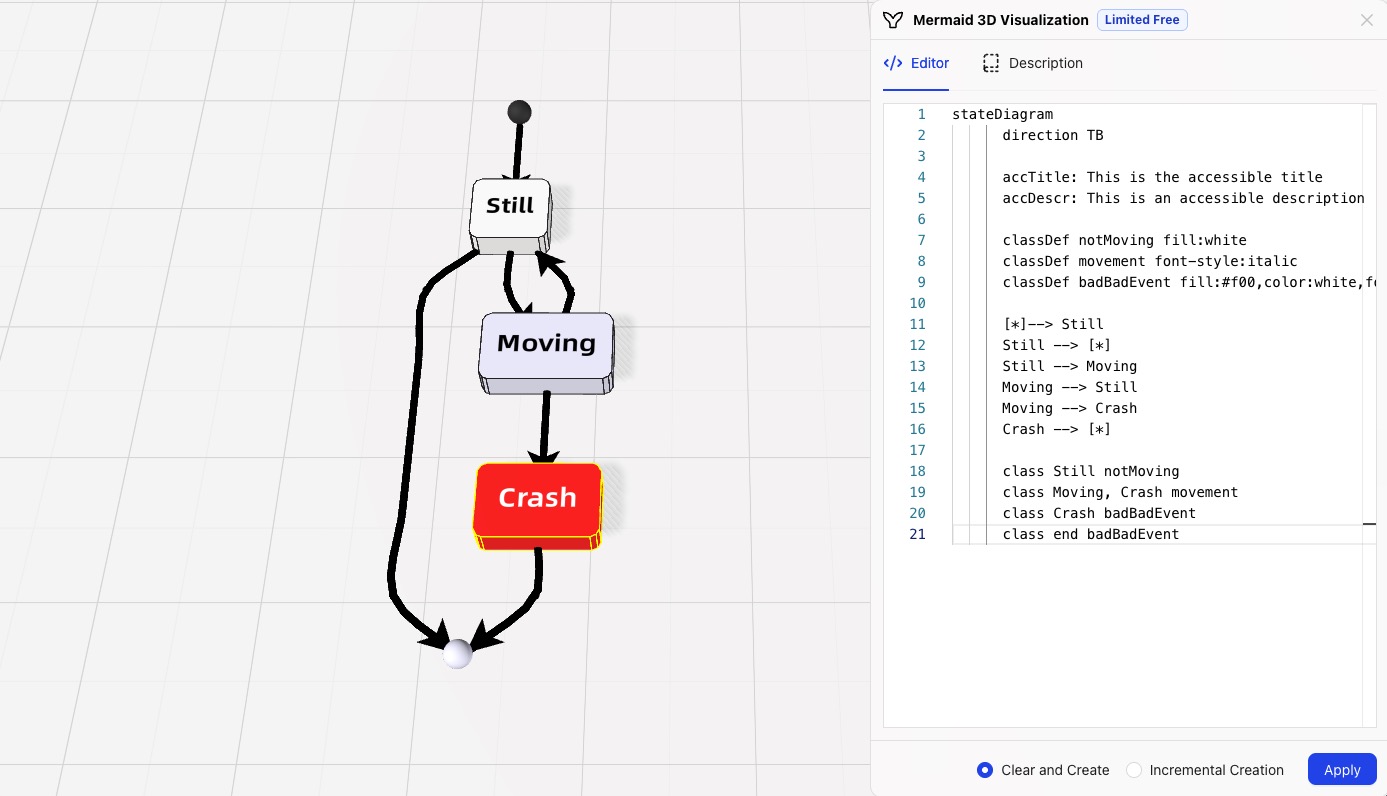
stateDiagram
  direction TB

  accTitle: This is the accessible title
  accDescr: This is an accessible description

  classDef notMoving fill:white
  classDef movement font-style:italic
  classDef badBadEvent fill:#f00,color:white,font-weight:bold,stroke-width:2px,stroke:yellow

  [*]--> Still
  Still --> [*]
  Still --> Moving
  Moving --> Still
  Moving --> Crash
  Crash --> [*]

  class Still notMoving
  class Moving, Crash movement
  class Crash badBadEvent
  class end badBadEvent
The above styles (e.g., class and arrows) are automatically parsed and mapped in the 3D scene to colors, connectors, arrowheads, and material/shadow effects.
Result
Why 3D Visualization
- Stronger hierarchical expression: multi‑level architecture, nesting, and grouping are more intuitive in space
- Better presentation: rotation, zoom, and viewpoint switching make explanations more vivid
- More information dimensions: color, transparency, shape, material, and shadows jointly convey state
- Better for complex systems: distributed, microservices, and cloud‑native topologies become clearer
Typical scenarios:
- Technical reviews and proposal presentations: present architecture and flows in 3D scenes to increase persuasiveness
- Cross‑team collaboration: provide a unified spatial language for engineering, product, and operations
- Training and drills: combine camera viewpoints and animations to build a more immersive presentation experience
Get Started
- Paste Mermaid code into iCraft Editor
- Choose “Mermaid 3D Visualization” to automatically parse and generate a 3D scene
- Drag, rotate, and zoom to view from different angles; select elements and connections to interact
Direct link https://icraft.gantcloud.com/app/editor?defaultOpen=mermaid&preview=true (opens in a new tab)
FAQ
Which syntax types are currently supported?
After evaluation, the following diagram types are suitable for 3D visualization and are currently supported:
- architecture
- flowchart
- stateDiagram
If you have strong demand for other types, please contact us.
Is the processing logic performed on the client?
Yes. All parsing and 3D rendering are done locally in the browser. No Mermaid data is uploaded to the server, protecting your privacy.